Cap on tax deductions boosts demand for lower-tax homes as high-end sales stagnate
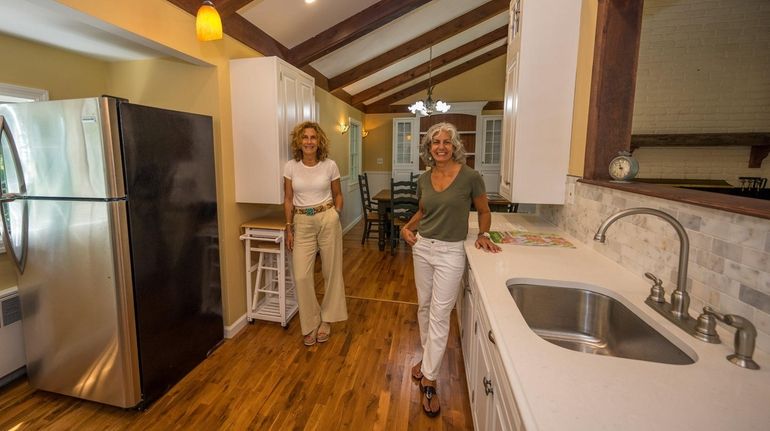
Real estate investor Detra Sarris, at right with agent Risa Ziegler, is selling this Huntington home with her business partner, Diane Gorenstein. It's listed at $715,000 and carries taxes of $12,455. Credit: Daniel Goodrich
The $10,000 cap on deductions for state and local taxes has spurred demand for Long Island homes with relatively low property taxes and contributed to a slowdown in the high-end market, real estate professionals say. The effects have been softened by falling interest rates and a strong economy.
This spring marked the first time taxpayers’ returns reflected the changes enacted in December 2017, when President Donald Trump signed a sweeping federal tax overhaul into law. Until the 2018 tax year, many homeowners could deduct the full amount of their state and local real estate, income, sales and other taxes.
Only 25¢ for 5 months
The $10,000 cap on deductions for state and local taxes has spurred demand for Long Island homes with relatively low property taxes and contributed to a slowdown in the high-end market, real estate professionals say. The effects have been softened by falling interest rates and a strong economy.
This spring marked the first time taxpayers’ returns reflected the changes enacted in December 2017, when President Donald Trump signed a sweeping federal tax overhaul into law. Until the 2018 tax year, many homeowners could deduct the full amount of their state and local real estate, income, sales and other taxes.
Long Islanders’ property tax bills are among the highest in the country, and the cost of living is burdensome. Losing the ability to deduct state and local taxes on federal returns makes living on Long Island even costlier, and gives home buyers one more reason to hesitate, local real estate brokers said.
“The taxes on Long Island are certainly, for the most part, higher than $10,000, let’s face it, so it created a pause, it really did,” Ann Conroy, president of Douglas Elliman’s Long Island division, said of the $10,000 cap. “In the higher end, you have properties with $30,000, $40,000 and up in taxes…. I think it did affect that marketplace.”
By contrast, Conroy said, the market for starter and mid-priced homes is “very, very hot right now.”
Overall, Long Island’s real estate market is strong, especially in the middle and lower price ranges. On Long Island, excluding the East End, the median price was $445,000 in the April-through-June quarter, up 4.7 percent from a year earlier, according to the most recent report by Douglas Elliman and the Manhattan-based appraisal company Miller Samuel. The number of sales was up annually by almost 2 percent.
On the North Fork, homes sold for a median price of $644,500 in the second quarter, up 8.8 percent from a year before, and the number of sales spiked by 25.5 percent.
Higher-end markets have seen declines, though.
In the Hamptons, the median price fell by 4.2 percent, year over year, to $850,000. The number of sales dropped annually by 1 percent, making it the slowest spring in eight years, Miller Samuel reported. With so many properties sitting on the market, the number of Hamptons homes listed for sale soared by 84 percent compared with a year earlier.
“Is it the only reason the home sales market has pulled back? No, but it certainly contributes to it,” Judi Desiderio, chief executive of Town & Country Real Estate, based in East Hampton, said of the cap on deductions.
The new limit can hit retirees especially hard. “When you’re retired and your taxes are near $20,000 or more, that’s an awful lot of retirement money," Desiderio said.
Throughout Nassau County and western Suffolk, too, demand is strongest at the lower end. Splitting the market for single-family homes into five bands, ranked by price, shows how the trend plays out. In the bottom fifth of the market – where homes sold for a median $280,000 – prices jumped by 9.5 percent, year over year, Miller Samuel figures show. In the middle of the market, prices rose more modestly, from 1.6 percent to 5 percent annually, with the biggest increases in the lower ranges. And in the top fifth of the market – where the median price was $834,820 – prices fell by 2.1 percent in a year.
The new $10,000 limit on deductions “puts a wet blanket” on the luxury market, which already had an oversupply of homes, said Jonathan Miller, chief executive of Miller Samuel. “You’re losing affordability” due to the new limit on deductions, Miller said.
However, he said, “its negative impact on the market was partially offset by an unprecedented drop in mortgage rates over the past year.”
The average interest rate for a 30-year mortgage was 3.75 percent last week, down 0.85 percentage points from a year earlier, mortgage giant Freddie Mac reported.
The strong economy also has benefited the real estate market. On Long Island, the jobless rate fell to 3.1 percent in June, the lowest June rate since 1990. New York City’s jobless rate was 4.2 percent that month. Wall Street boasted 181,300 jobs last year, the most in a decade, although the average bonus fell by 17 percent annually, to $153,700, state Comptroller Thomas DiNapoli reported earlier this year.
Some brokers said the $10,000 limit on deductions has had little impact, in part because it affects homeowners’ annual tax bills, not their monthly payments.
“We definitely have buyers that are tax-sensitive, and we always have,” said Gary Baumann, an associate broker with Keller Williams Points North in Woodbury and Keller Williams Greater Nassau in Garden City. But, he said, “if you’re buying a house or you’re buying a car, people just want to know what the monthly payment is.”
The effect of the $10,000 cap on tax bills is “a lot more complicated” than it might appear, said Jude Coard, Jericho-based leader of the tax department at Berdon LLP.
Some Long Islanders – in particular, certain taxpayers earning about $250,000 or more – benefited from the tax overhaul, including lower top rates, he said. “Overall, it’s better than most people feared."
However, he said, for other taxpayers, including high-earning professionals such as attorneys, doctors and accountants, changes such as lower top tax rates are “not enough to offset” the loss of deductions for state and local taxes over the $10,000 limit.
Long Island’s high property taxes do deter some potential buyers, especially if they can find lower-tax alternatives.
Petros Chalkitis, 41, a pediatric occupational therapist, was looking to move out of Astoria, Queens, with his wife and two young children, and initially he looked in Roslyn Heights and Willison Park, where the homes he saw came with tax bills of $13,000 or more. But then, he said, a friend who lives in New Jersey encouraged him to look there. He found a home in Closter in a great school district and a tax bill of about $7,500, he said.
“It’s always on your mind, you’re always thinking, ‘What are the breaks?’ I didn’t want to go over $10,000,” he said. After comparing the homes he and his wife saw, he recalled, “I said to myself, Do I want to pay $13,000 or $14,000 for the rest of my life, or do I want to pay $7,500 for the rest of my life? It makes a big difference.”
Real estate taxes are “a big factor as to why people refrain from coming to the Island,” said Roy Clark, a real estate agent with L I Community Realty in Brentwood. “The $10,000 cap really just makes it so much worse, because everyone heard about it. It just made them believe that it’s really unreachable.”
Clark said he reminds buyers that if they move from New York City to Long Island, their cost of living could go down in other ways, such as potentially lower local income tax and car insurance rates. Plus, he said, in Suffolk County communities such as Patchogue, Mastic and Shirley, it’s possible to buy a nice-sized, reasonably priced house with taxes under $7,000.
The new limit is prompting real estate agents to take on a more active role in making sure homes’ property tax bills are not any higher than they need to be, agents said.
“One of our jobs now is to see if the house is being over-assessed,” said Lynda Olita, an associate broker at Douglas Elliman in Huntington. Olita said when property taxes are higher than $20,000 or $25,000 a year, buyers are more likely to hesitate.
That increases the appeal of homes with comparatively low taxes, she said. Olita has listed a four-bedroom home in Huntington for $969,000, and she said the home’s annual property tax bill of $15,654 is “considered pretty reasonable” for that price range in Huntington. “It’s still not cheap, but it’s definitely not $20,000 and above,” she said.
Robert Gee, 57, of Manorville, who has listed his late father’s four-bedroom house in New Hyde Park for $719,000, said he knows the home’s relatively low property taxes of $11,225 would not be the deciding factor for a potential buyer, but he hopes it would add to its appeal.
If a buyer is looking at two or three comparable homes with higher tax bills, he said, “that might the one thing that says buy our house over house B or house C.”
The cap on deductions also has prompted real estate investors to scrutinize property tax bills more closely.
Buyers “are looking for more value for the price; they’re not going to have as many write-offs,” said Detra Sarris, 57, of Centerport, who buys, renovates and sells homes with a business partner, Diane Gorenstein of Huntington. “We won’t buy a house if the sale price is good but the taxes are too high. We’ll just move on to the next one.”
| Location | Zip | County | Average income | Average Taxes Paid (state and local income and sales, real estate and personal property) | Number of sales, 2019 Q2 | Number of sales, 2017 Q2 | % change, # of sales Q2 2017 to Q2 2019 | Median price, 2019 Q2 | Median price, 2017 Q2 | % change median price, Q2 2017 to Q2 2019 |
|---|---|---|---|---|---|---|---|---|---|---|
| Statewide | 00000 | Statewide | $83,979.25 | 7,605 | * | * | * | * | ||
| Albertson | 11507 | Nassau | $131,751.98 | 14,386 | 14 | 15 | -7% | $748,500 | $680,000 | 10% |
| Atlantic Beach | 11509 | Nassau | $206,953.91 | 25,944 | 5 | 12 | -58% | $650,000 | $555,000 | 17% |
| Baldwin | 11510 | Nassau | $74,897.96 | 7,591 | 88 | 54 | 63% | $451,500 | $386,500 | 17% |
| Bayville | 11709 | Nassau | $107,724.01 | 10,960 | 25 | 8 | 213% | $550,000 | $740,000 | -26% |
| Bellmore | 11710 | Nassau | $104,131.55 | 10,659 | 75 | 84 | -11% | $495,000 | $465,000 | 6% |
| Bethpage | 11714 | Nassau | $78,275.28 | 7,795 | 50 | 46 | 9% | $487,500 | $445,225 | 9% |
| Carle Place | 11514 | Nassau | $81,942.41 | 7,680 | 6 | 8 | -25% | $496,000 | $555,000 | -11% |
| Cedarhurst | 11516 | Nassau | $140,556.40 | 12,398 | 11 | 14 | -21% | $327,500 | $632,500 | -48% |
| East Meadow | 11554 | Nassau | $83,191.11 | 7,955 | 77 | 64 | 20% | $525,000 | $473,500 | 11% |
| East Norwich | 11732 | Nassau | $190,220.21 | 18,146 | 9 | 5 | 80% | $695,000 | $666,200 | 4% |
| East Rockaway | 11518 | Nassau | $116,132.68 | 11,370 | 31 | 37 | -16% | $440,000 | $360,000 | 22% |
| Elmont | 11003 | Nassau | $53,466.85 | 4,532 | 82 | 63 | 30% | $472,500 | $410,000 | 15% |
| Floral Park | 11001 | Nassau | $88,590.84 | 9,108 | 43 | 47 | -9% | $620,000 | $550,000 | 13% |
| Franklin Square | 11010 | Nassau | $75,826.94 | 7,442 | 46 | 37 | 24% | $532,000 | $525,500 | 1% |
| Freeport | 11520 | Nassau | $52,017.82 | 4,670 | 97 | 104 | -7% | $345,000 | $327,500 | 5% |
| Garden City | 11530 | Nassau | $237,926.88 | 28,379 | 74 | 82 | -10% | $855,000 | $862,500 | -1% |
| Glen Cove | 11542 | Nassau | $82,484.10 | 7,940 | 51 | 50 | 2% | $540,000 | $497,500 | 9% |
| Glen Head | 11545 | Nassau | $351,777.74 | 39,763 | 33 | 28 | 18% | $829,000 | $799,000 | 4% |
| Glenwood Landing | 11547 | Nassau | * | * | 5 | 1 | 400% | $600,000 | $412,500 | 45% |
| Great Neck | 11020 | Nassau | $207,647.54 | 23,698 | 18 | 21 | -14% | $1,127,500 | $1,185,000 | -5% |
| Great Neck | 11023 | Nassau | $193,767.59 | 22,173 | 17 | 23 | -26% | $1,050,000 | $1,050,000 | 0% |
| Great Neck | 11021 | Nassau | $176,933.05 | 18,414 | 58 | 82 | -29% | $616,500 | $383,000 | 61% |
| Great Neck | 11024 | Nassau | $422,827.22 | 55,916 | 8 | 14 | -43% | $1,200,000 | $1,480,000 | -19% |
| Greenvale | 11548 | Nassau | $147,740.00 | 16,434 | 1 | 1 | 0% | $1,040,000 | $620,000 | 68% |
| Hempstead | 11550 | Nassau | $42,037.85 | 3,338 | 74 | 64 | 16% | $362,500 | $248,750 | 46% |
| Hewlett | 11557 | Nassau | $195,001.70 | 23,659 | 25 | 21 | 19% | $595,000 | $571,000 | 4% |
| Hicksville | 11801 | Nassau | $67,991.91 | 5,955 | 84 | 83 | 1% | $504,050 | $459,000 | 10% |
| Inwood | 11096 | Nassau | $40,581.22 | 2,384 | 3 | 4 | -25% | $245,500 | $367,500 | -33% |
| Island Park | 11558 | Nassau | $76,251.76 | 6,641 | 19 | 14 | 36% | $500,000 | $367,500 | 36% |
| Jericho | 11753 | Nassau | $230,421.74 | 26,585 | 50 | 39 | 28% | $879,000 | $820,000 | 7% |
| Lawrence | 11559 | Nassau | $265,244.82 | 28,179 | 14 | 16 | -13% | $437,500 | $370,000 | 18% |
| Levittown | 11756 | Nassau | $72,869.82 | 7,210 | 121 | 110 | 10% | $440,000 | $405,000 | 9% |
| Locust Valley | 11560 | Nassau | $336,084.38 | 39,273 | 19 | 18 | 6% | $995,000 | $750,000 | 33% |
| Long Beach | 11561 | Nassau | $98,825.31 | 8,966 | 129 | 148 | -13% | $505,000 | $458,500 | 10% |
| Lynbrook | 11563 | Nassau | $86,160.79 | 9,353 | 45 | 64 | -30% | $435,000 | $419,250 | 4% |
| Malverne | 11565 | Nassau | $104,190.40 | 11,917 | 24 | 22 | 9% | $545,000 | $465,000 | 17% |
| Manhasset | 11030 | Nassau | $362,262.98 | 42,412 | 48 | 67 | -28% | $1,624,500 | $1,510,000 | 8% |
| Massapequa | 11758 | Nassau | $100,882.07 | 10,771 | 138 | 122 | 13% | $530,000 | $490,000 | 8% |
| Massapequa Park | 11762 | Nassau | $100,808.95 | 10,786 | 54 | 47 | 15% | $539,500 | $441,000 | 22% |
| Merrick | 11566 | Nassau | $124,753.61 | 13,622 | 87 | 91 | -4% | $540,000 | $541,500 | 0% |
| Mill Neck | 11765 | Nassau | $812,942.42 | 114,212 | 1 | 3 | -67% | $2,600,000 | $1,520,000 | 71% |
| Mineola | 11501 | Nassau | $82,887.39 | 7,057 | 27 | 40 | -33% | $512,500 | $478,500 | 7% |
| New Hyde Park | 11040 | Nassau | $103,711.02 | 10,767 | 71 | 64 | 11% | $710,000 | $702,000 | 1% |
| Oceanside | 11572 | Nassau | $94,763.78 | 9,668 | 83 | 73 | 14% | $495,000 | $460,000 | 8% |
| Old Bethpage | 11804 | Nassau | $128,937.05 | 14,959 | 15 | 12 | 25% | $645,000 | $612,500 | 5% |
| Old Westbury | 11568 | Nassau | $625,715.79 | 82,194 | 8 | 5 | 60% | $1,940,000 | $1,825,000 | 6% |
| Oyster Bay | 11771 | Nassau | $477,482.72 | 47,072 | 34 | 32 | 6% | $717,500 | $642,500 | 12% |
| Plainview | 11803 | Nassau | $135,920.52 | 15,690 | 85 | 67 | 27% | $635,000 | $542,500 | 17% |
| Point Lookout | 11569 | Nassau | * | * | 3 | 8 | -63% | $790,000 | $716,500 | 10% |
| Port Washington | 11050 | Nassau | $199,875.45 | 22,518 | 59 | 77 | -23% | $950,000 | $925,000 | 3% |
| Rockville Centre | 11570 | Nassau | $154,885.65 | 17,293 | 58 | 83 | -30% | $635,000 | $629,000 | 1% |
| Roosevelt | 11575 | Nassau | $39,446.76 | 2,741 | 36 | 37 | -3% | $410,000 | $275,000 | 49% |
| Roslyn | 11576 | Nassau | $299,022.99 | 34,991 | 44 | 35 | 26% | $1,187,500 | $965,000 | 23% |
| Roslyn Heights | 11577 | Nassau | $182,880.41 | 22,771 | 31 | 38 | -18% | $850,000 | $838,250 | 1% |
| Sea Cliff | 11579 | Nassau | $149,646.54 | 16,642 | 10 | 20 | -50% | $742,500 | $655,000 | 13% |
| Seaford | 11783 | Nassau | $95,224.07 | 10,012 | 57 | 40 | 43% | $510,000 | $482,500 | 6% |
| Syosset | 11791 | Nassau | $226,155.14 | 26,561 | 77 | 80 | -4% | $805,000 | $750,000 | 7% |
| Uniondale | 11553 | Nassau | $42,970.57 | 2,864 | 28 | 24 | 17% | $405,500 | $365,000 | 11% |
| Valley Stream | 11581 | Nassau | $88,618.84 | 8,986 | 43 | 44 | -2% | $485,000 | $481,250 | 1% |
| Valley Stream | 11580 | Nassau | $66,248.10 | 6,331 | 82 | 94 | -13% | $500,000 | $427,000 | 17% |
| Wantagh | 11793 | Nassau | $99,454.45 | 10,803 | 75 | 64 | 17% | $515,000 | $450,000 | 14% |
| West Hempstead | 11552 | Nassau | $78,663.02 | 7,762 | 56 | 39 | 44% | $484,525 | $412,000 | 18% |
| Westbury | 11590 | Nassau | $68,845.26 | 6,420 | 106 | 90 | 18% | $440,000 | $420,000 | 5% |
| Williston Park | 11596 | Nassau | $123,516.85 | 13,043 | 15 | 10 | 50% | $695,000 | $597,500 | 16% |
| Woodbury | 11797 | Nassau | $251,012.36 | 29,469 | 26 | 22 | 18% | $805,000 | $720,000 | 12% |
| Woodmere | 11598 | Nassau | $198,312.14 | 21,603 | 16 | 37 | -57% | $678,750 | $729,000 | -7% |
| Amityville | 11701 | Suffolk | $57,637.66 | 5,190 | 61 | 54 | 13% | $390,000 | $325,000 | 20% |
| Babylon | 11702 | Suffolk | $104,954.55 | 11,536 | 47 | 41 | 15% | $440,000 | $452,500 | -3% |
| Bay Shore | 11706 | Suffolk | $58,841.73 | 5,729 | 149 | 126 | 18% | $360,000 | $291,500 | 23% |
| Bayport | 11705 | Suffolk | $108,534.49 | 11,929 | 16 | 19 | -16% | $459,000 | $428,000 | 7% |
| Bellport | 11713 | Suffolk | $63,665.25 | 5,123 | 23 | 24 | -4% | $289,500 | $235,000 | 23% |
| Blue Point | 11715 | Suffolk | $98,472.95 | 10,376 | 11 | 13 | -15% | $529,999 | $400,000 | 32% |
| Bohemia | 11716 | Suffolk | $78,370.49 | 7,535 | 26 | 22 | 18% | $420,000 | $390,000 | 8% |
| Brentwood | 11717 | Suffolk | $37,067.03 | 2,317 | 89 | 95 | -6% | $355,000 | $295,000 | 20% |
| Brightwaters | 11718 | Suffolk | $189,786.52 | 16,703 | 5 | 3 | 67% | $480,000 | $499,000 | -4% |
| Brookhaven | 11719 | Suffolk | $94,740.63 | 9,405 | 9 | 12 | -25% | $401,500 | $452,750 | -11% |
| Calverton | 11933 | Suffolk | $74,077.68 | 6,345 | 30 | 42 | -29% | $366,995 | $210,750 | 74% |
| Center Moriches | 11934 | Suffolk | $85,364.59 | 8,901 | 26 | 26 | 0% | $376,317 | $412,500 | -9% |
| Centereach | 11720 | Suffolk | $72,292.45 | 6,818 | 101 | 62 | 63% | $355,000 | $297,500 | 19% |
| Centerport | 11721 | Suffolk | $153,232.34 | 17,410 | 32 | 17 | 88% | $695,000 | $575,000 | 21% |
| Central Islip | 11722 | Suffolk | $43,281.73 | 3,221 | 106 | 87 | 22% | $310,000 | $239,000 | 30% |
| Cold Spring Harbor | 11724 | Suffolk | $309,168.90 | 37,377 | 6 | 22 | -73% | $1,062,375 | $1,307,500 | -19% |
| Commack | 11725 | Suffolk | $112,704.87 | 12,319 | 84 | 71 | 18% | $515,000 | $462,000 | 11% |
| Copiague | 11726 | Suffolk | $46,840.44 | 3,836 | 59 | 33 | 79% | $379,999 | $280,000 | 36% |
| Coram | 11727 | Suffolk | $63,224.59 | 5,173 | 114 | 97 | 18% | $278,500 | $230,900 | 21% |
| Cutchogue | 11935 | Suffolk | $111,708.21 | 10,533 | * | * | * | * | ||
| Deer Park | 11729 | Suffolk | $63,830.24 | 5,852 | 56 | 65 | -14% | $418,500 | $345,000 | 21% |
| East Hampton | 11937 | Suffolk | $127,415.45 | 12,594 | * | * | * | * | ||
| East Islip | 11730 | Suffolk | $93,843.82 | 9,982 | 39 | 33 | 18% | $435,000 | $347,000 | 25% |
| East Marion | 11939 | Suffolk | $102,364.15 | 9,475 | * | * | * | * | ||
| East Moriches | 11940 | Suffolk | $103,104.69 | 9,925 | 19 | 12 | 58% | $417,000 | $355,000 | 17% |
| East Northport | 11731 | Suffolk | $99,283.83 | 9,843 | 72 | 70 | 3% | $489,500 | $466,650 | 5% |
| East Quogue | 11942 | Suffolk | $101,539.46 | 8,138 | * | * | * | * | ||
| East Setauket | 11733 | Suffolk | $257,193.39 | 29,830 | 63 | 53 | 19% | $535,000 | $439,980 | 22% |
| Eastport | 11941 | Suffolk | $89,859.29 | 9,634 | 10 | 11 | -9% | $572,000 | $550,000 | 4% |
| Farmingdale | 11735 | Suffolk | $83,488.64 | 8,247 | 77 | 66 | 17% | $439,990 | $426,250 | 3% |
| Farmingville | 11738 | Suffolk | $69,669.20 | 6,078 | 32 | 48 | -33% | $350,000 | $312,500 | 12% |
| Great River | 11739 | Suffolk | * | * | 2 | 4 | -50% | $535,000 | $550,000 | -3% |
| Greenlawn | 11740 | Suffolk | $112,401.74 | 12,214 | 31 | 20 | 55% | $672,000 | $512,500 | 31% |
| Greenport | 11944 | Suffolk | $74,730.21 | 5,349 | * | * | * | * | ||
| Hampton Bays | 11946 | Suffolk | $72,989.10 | 5,918 | * | * | * | * | ||
| Hauppauge | 11788 | Suffolk | $99,222.98 | 9,522 | 32 | 21 | 52% | $487,500 | $462,000 | 6% |
| Holbrook | 11741 | Suffolk | $77,648.03 | 6,681 | 63 | 77 | -18% | $395,000 | $348,500 | 13% |
| Holtsville | 11742 | Suffolk | $77,026.28 | 6,688 | 38 | 35 | 9% | $367,500 | $329,000 | 12% |
| Huntington | 11743 | Suffolk | $173,144.96 | 18,911 | 111 | 156 | -29% | $615,000 | $600,000 | 3% |
| Huntington Station | 11746 | Suffolk | $104,996.26 | 11,005 | 161 | 145 | 11% | $500,000 | $440,000 | 14% |
| Islandia | 11749 | Suffolk | $62,808.84 | 5,765 | 14 | 15 | -7% | $312,500 | $240,000 | 30% |
| Islip | 11751 | Suffolk | $85,819.31 | 9,294 | 42 | 42 | 0% | $365,000 | $317,000 | 15% |
| Islip Terrace | 11752 | Suffolk | $68,962.76 | 6,783 | 22 | 21 | 5% | $398,000 | $329,000 | 21% |
| Kings Park | 11754 | Suffolk | $92,327.07 | 9,220 | 46 | 28 | 64% | $473,500 | $416,500 | 14% |
| Lake Grove | 11755 | Suffolk | $85,591.40 | 8,372 | 26 | 29 | -10% | $502,450 | $365,000 | 38% |
| Laurel | 11948 | Suffolk | $85,963.77 | 8,125 | * | * | * | * | ||
| Lindenhurst | 11757 | Suffolk | $63,162.74 | 6,044 | 106 | 111 | -5% | $381,500 | $325,000 | 17% |
| Manorville | 11949 | Suffolk | $84,799.45 | 8,855 | 68 | 40 | 70% | $382,500 | $357,500 | 7% |
| Mastic | 11950 | Suffolk | $49,532.20 | 3,991 | 62 | 40 | 55% | $224,250 | $154,950 | 45% |
| Mastic Beach | 11951 | Suffolk | $49,465.87 | 3,642 | 62 | 58 | 7% | $180,125 | $129,745 | 39% |
| Mattituck | 11952 | Suffolk | $101,689.58 | 9,126 | * | * | * | * | ||
| Medford | 11763 | Suffolk | $65,462.33 | 5,679 | 97 | 76 | 28% | $312,000 | $268,000 | 16% |
| Melville | 11747 | Suffolk | $188,045.80 | 17,988 | 50 | 66 | -24% | $680,000 | $596,250 | 14% |
| Middle Island | 11953 | Suffolk | $63,102.11 | 5,052 | 56 | 73 | -23% | $239,750 | $200,000 | 20% |
| Miller Place | 11764 | Suffolk | $107,860.22 | 12,179 | 38 | 28 | 36% | $457,500 | $378,000 | 21% |
| Montauk | 11954 | Suffolk | $87,978.73 | 7,403 | * | * | * | * | ||
| Moriches | 11955 | Suffolk | $68,758.96 | 4,770 | 16 | 7 | 129% | $385,000 | $337,500 | 14% |
| Mount Sinai | 11766 | Suffolk | $115,692.25 | 12,296 | 36 | 43 | -16% | $469,000 | $430,000 | 9% |
| Nesconset | 11767 | Suffolk | $106,528.69 | 10,838 | 29 | 34 | -15% | $475,000 | $421,500 | 13% |
| North Babylon | 11703 | Suffolk | $67,605.10 | 6,308 | 42 | 52 | -19% | $392,500 | $332,250 | 18% |
| Northport | 11768 | Suffolk | $153,356.78 | 16,489 | 68 | 78 | -13% | $665,000 | $602,725 | 10% |
| Oakdale | 11769 | Suffolk | $91,713.39 | 9,574 | 27 | 34 | -21% | $425,000 | $385,500 | 10% |
| Orient | 11957 | Suffolk | $158,331.11 | 14,680 | * | * | * | * | ||
| Patchogue | 11772 | Suffolk | $63,373.95 | 5,751 | 120 | 120 | 0% | $350,000 | $267,000 | 31% |
| Peconic | 11958 | Suffolk | $132,126.00 | 10,192 | * | * | * | * | ||
| Port Jefferson | 11777 | Suffolk | $174,989.15 | 17,511 | 25 | 36 | -31% | $480,000 | $430,500 | 11% |
| Port Jefferson Station | 11776 | Suffolk | $69,189.55 | 6,395 | 86 | 77 | 12% | $350,000 | $317,000 | 10% |
| Ridge | 11961 | Suffolk | $65,003.32 | 5,503 | 67 | 73 | -8% | $265,000 | $233,000 | 14% |
| Riverhead | 11901 | Suffolk | $53,194.93 | 3,648 | 56 | 71 | -21% | $310,000 | $250,000 | 24% |
| Rocky Point | 11778 | Suffolk | $75,122.13 | 7,126 | 60 | 58 | 3% | $280,000 | $265,885 | 5% |
| Ronkonkoma | 11779 | Suffolk | $70,130.39 | 6,090 | 105 | 84 | 25% | $354,994 | $327,500 | 8% |
| Sag Harbor | 11963 | Suffolk | $151,605.17 | 13,610 | * | * | * | * | ||
| Saint James | 11780 | Suffolk | $212,150.00 | 25,844 | 37 | 41 | -10% | $456,500 | $488,500 | -7% |
| Sayville | 11782 | Suffolk | $100,659.85 | 10,646 | 35 | 38 | -8% | $390,000 | $387,000 | 1% |
| Selden | 11784 | Suffolk | $61,246.44 | 5,791 | 76 | 58 | 31% | $324,000 | $230,500 | 41% |
| Shirley | 11967 | Suffolk | $56,530.02 | 4,963 | 104 | 96 | 8% | $270,000 | $199,500 | 35% |
| Shoreham | 11786 | Suffolk | $106,732.06 | 11,579 | 25 | 15 | 67% | $453,500 | $349,990 | 30% |
| Smithtown | 11787 | Suffolk | $114,978.95 | 12,260 | 99 | 97 | 2% | $500,000 | $465,000 | 8% |
| Sound Beach | 11789 | Suffolk | $69,358.45 | 6,250 | 24 | 36 | -33% | $305,000 | $223,000 | 37% |
| Southampton | 11968 | Suffolk | $131,779.77 | 12,970 | * | * | * | * | ||
| Southold | 11971 | Suffolk | $98,379.93 | 9,417 | * | * | * | * | ||
| Stony Brook | 11790 | Suffolk | $127,074.48 | 13,656 | 36 | 42 | -14% | $466,500 | $437,000 | 7% |
| Wading River | 11792 | Suffolk | $102,888.55 | 11,208 | 25 | 22 | 14% | $410,000 | $353,750 | 16% |
| Water Mill | 11976 | Suffolk | $284,541.44 | 29,623 | * | * | * | * | ||
| West Babylon | 11704 | Suffolk | $61,945.03 | 5,602 | 87 | 80 | 9% | $386,500 | $321,000 | 20% |
| West Islip | 11795 | Suffolk | $97,496.97 | 10,801 | 55 | 71 | -23% | $500,014 | $390,000 | 28% |
| West Sayville | 11796 | Suffolk | $84,139.36 | 8,385 | 2 | 8 | -75% | $565,000 | $414,998 | 36% |
| Westhampton | 11977 | Suffolk | $107,297.76 | 10,440 | * | * | * | * | ||
| Westhampton Beach | 11978 | Suffolk | $111,677.60 | 9,268 | * | * | * | * | ||
| Wyandanch | 11798 | Suffolk | $43,403.72 | 3,413 | 41 | 28 | 46% | $305,000 | $257,495 | 18% |
| Yaphank | 11980 | Suffolk | $72,767.74 | 6,239 | 13 | 14 | -7% | $288,400 | $225,250 | 28% |
Top to bottom effect
Breaking the single-family-home market into five bands, ranked by price, shows how values have risen for low-end and mid-level homes and fallen for high-end properties.
Median price, April-June 2019 % change from a year earlier
$834,820 -2.1%
$558,000 1.6%
$459,000 4.3%
$380,000 5%
$280,000 9.5%
Source: Douglas Elliman and Miller Samuel